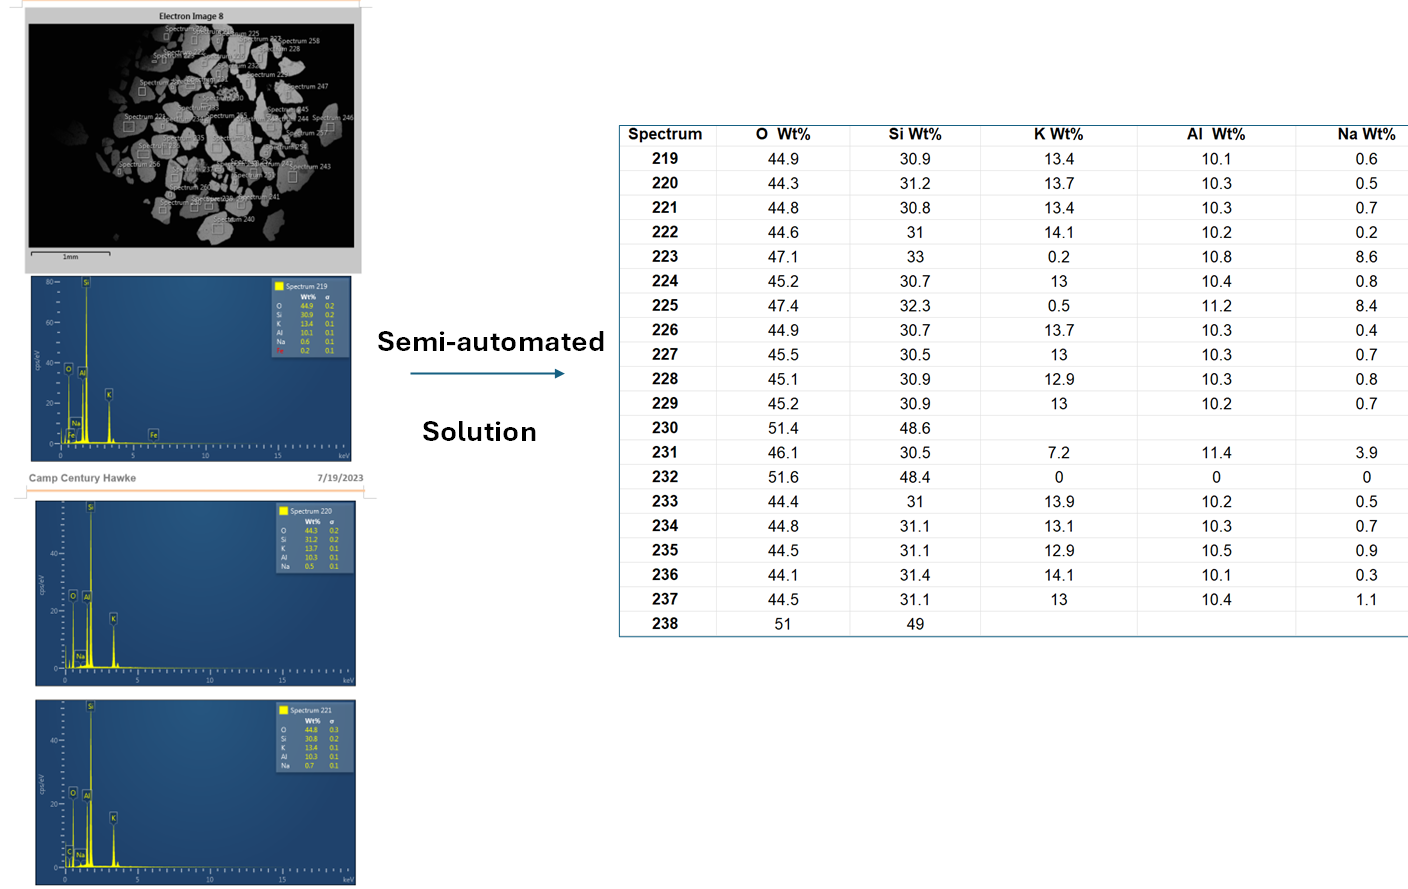
Semi-Automated Elemental Data Extraction from EDX Reports Using Python and ChatGPT
Comment 10/4/2024
I strongly suspect that the parameters in the ChatGPT model are still changing somehow. The same prompt yields different results even in the same conversation that ever generated perfect results. I also suspect they restrict easy access to the higher-performance OCR model unless you specifically push for it. If you use the prompt I suggested but don’t get the ideal result, start with a single image. Ask it to output the OCR result and then move on to multiple images, and then compile the result into a table. And always, check each image. It already saves you the time and effort of manually logging in, so it's worth spending time to ensure the results are accurate.
—————————————–Below is the old Blog—————————————–
Do you find logging elemental percentage data from a generated report to be time-consuming? Here's a quick solution, as long as you're familiar with basic Python and ChatGPT prompts:

- Save all the images from the EDX report using this script:
save_imgs_in_MSword.ipynb. Or you can copy from the code snippet at the bottom of this blog. The images will be automatically numbered and saved in the same directory as the report. - Remove unnecessary images: If the report contains images that are not EDX graphs, you can manually delete them.
- Use the ChatGPT-4 model: People are cautious about using ChatGPT, fearing it might provide fabricated answers. It’s true, this can happen at times. However, when it comes to OCR usage in EDX reports, I tested it for you. Using the prompts below, the results are reliable. This model has a robust embedded vision system that works well for OCR tasks. I tested several Python OCR libraries, even with data enhancement techniques, but none achieved satisfactory results. If you’re aware of any high-performance open-source OCR models, please share them!
-
Use the following prompt in ChatGPT:
For all the images I upload, extract the information from the legend and create a table. The first column should be “Spectrum,” and the subsequent columns should represent elemental information (O, Si, K, Al, Na) and their respective weight percentages (Wt%). Exclude the standard deviation (σ).
- Download the extracted data: ChatGPT will provide a table with the extracted data, which you can download as a CSV file.
- Verify the results: Randomly select a few graphs to check the accuracy of the data extraction by ChatGPT-4.
Notes:
- In ChatGPT, you can upload up to 10 images at a time and are subject to a daily upload limit. This process works well for small tasks.
- However, for larger datasets (like mine), I’m looking for a solution that can handle batch processing locally. If you have any suggestions or ideas, feel free to reach out!
Grab the codes
from docx import Document
from PIL import Image
import io

# Load the Word document
doc_path = 'Camp Century Hawke_USU-4183B 250-355 Points.docx'  # Update with your document path
doc = Document(doc_path)

# Iterate through the document and save images
for i, rel in enumerate(doc.part.rels.values()):
    if "image" in rel.target_ref:
        image = rel.target_part.blob
        image_stream = io.BytesIO(image)
        img = Image.open(image_stream)
        img.save(f'image_{i + 1}.png')  # Save images as PNG files

# Note: Update the file extension as needed based on the image type